Your Trusted Partner for Digital Transformation and System Integration
Weefer Indonesia offers a wide range of digital solutions to meet your business needs. From employee management, payroll, and attendance to performance management for developing employee potential. We also provide website and application development services, along with IT Endpoint Security and Backup solutions. Need software for communication, productivity, customer service, contact management, and cloud infrastructure? We have the solutions. So, where would you like to start your success journey?
Follow step by step to improve your customer and employee experience with our software solutions.
Human Capital Management
CRM & CX
IT Infrastructure
IT Security
ERP & BI
Ad-Hoc
Human Capital Management
Enhance your company’s work environment and culture with our Human Capital Management solutions. Deliver superior HR services and foster a strong employee experience.
SAP SuccessFactors
Improve your employee engagement through Employee Experience Management, Talent Management, Performance Management, HR Analytic, and Workforce Planning.
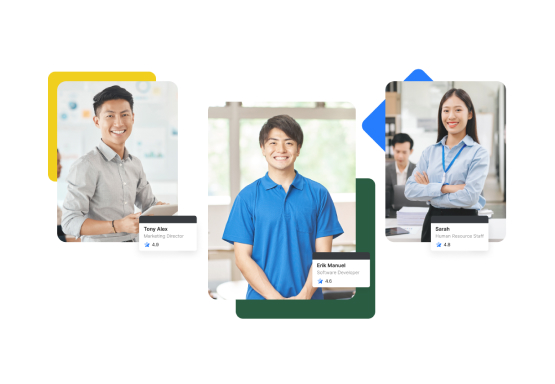
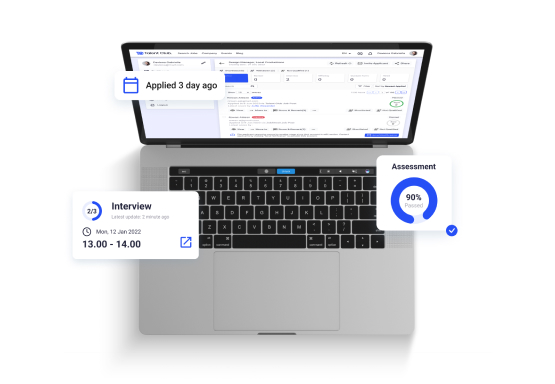
TalentClub is your go-to platform for discovering job opportunities and managing recruitment processes efficiently. With our advanced ATS, employers can streamline hiring, while job seekers can access a wide range of career opportunities all in one place.
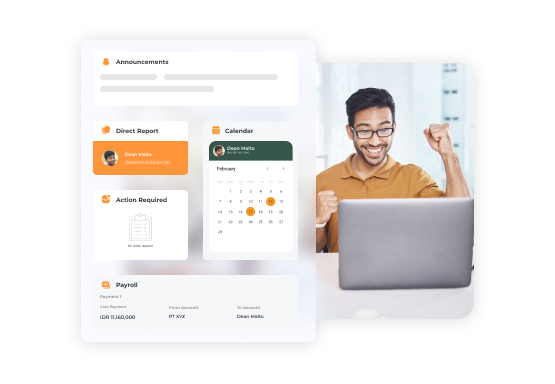
HRIS Software for digitalizing your Human Resource operations such as Employee Database, Payroll calculation, Attendance management, Employee Self-Service, Appraisal Management, and more.
TalentClub is your go-to platform for discovering job opportunities and managing recruitment processes efficiently. With our advanced ATS, employers can streamline hiring, while job seekers can access a wide range of career opportunities all in one place.
Transform your business with our Customer Relationship Management solutions. Foster a customer-centric environment and strengthen connections through optimized response times and accurate support. Equip your team with a comprehensive knowledge base to enhance satisfaction. Craft a clear customer journey map to ensure seamless and positive experiences at every touchpoint.
Neocrm
Connect Better and Bring the Ultimate Customer Experience Satisfaction. Neocrm empowers business quickly by identifying high-value prospects, improving customer satisfaction, and boosting long-term business growth.
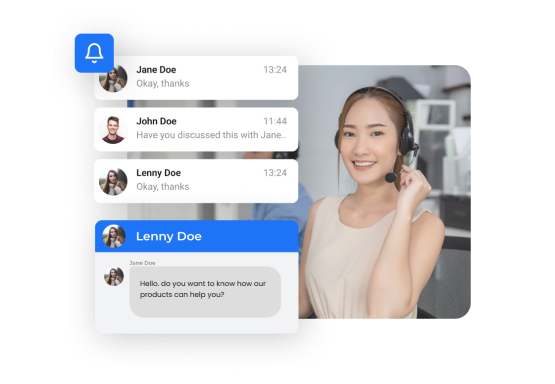
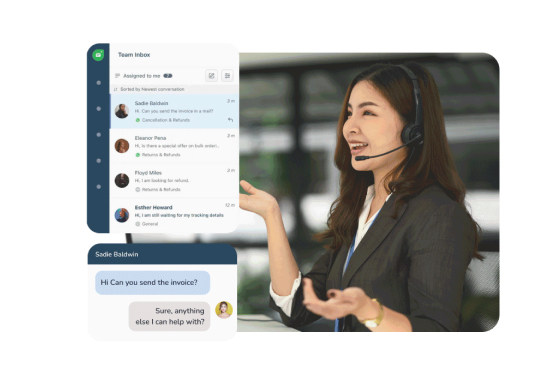
helps you deliver seamless customer support across multiple communication channels, all in one unified platform. With its intuitive interface and real-time capabilities, you can resolve issues faster and provide a personalized experience for every customer.
Manage your customers’ needs in helpdesk through ticketing system and make sure your agents provide the best support. Build customer-centric culture and Improve your customer satisfaction.
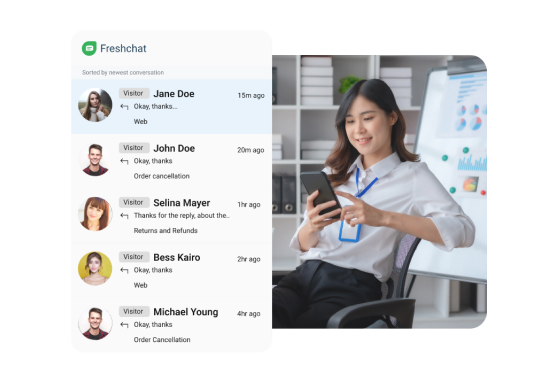
Engage your customer through web, mobile, and social messenger such as Whatsapp, Apple Apple Business Chat, Line, and Facebook Messenger. Delight them with AI and bots automations, and proactive campaign.
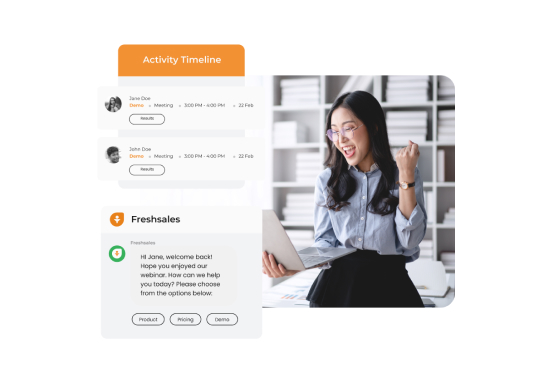
Give your sales the right CRM tools to generate more leads. Manage sales through smart pipeline, make sure your sales team focus on high potential leads – those who exhibit sales-ready buying signals and behaviors.
Connect Better and Bring the Ultimate Customer Experience Satisfaction. Neocrm empowers business quickly by identifying high-value prospects, improving customer satisfaction, and boosting long-term business growth.
helps you deliver seamless customer support across multiple communication channels, all in one unified platform. With its intuitive interface and real-time capabilities, you can resolve issues faster and provide a personalized experience for every customer.
Revolutionize your business with our IT Infrastructure Tool. Boost efficiency, enhance teamwork, and achieve seamless IT power anywhere.
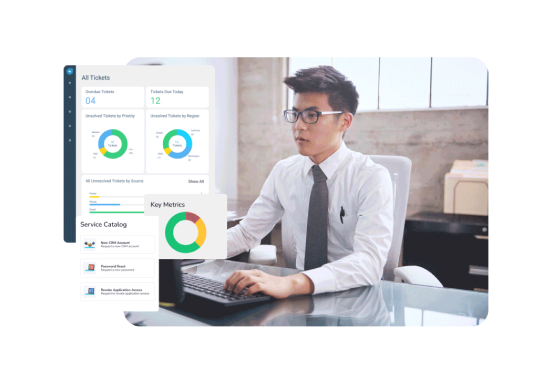
Freshservice
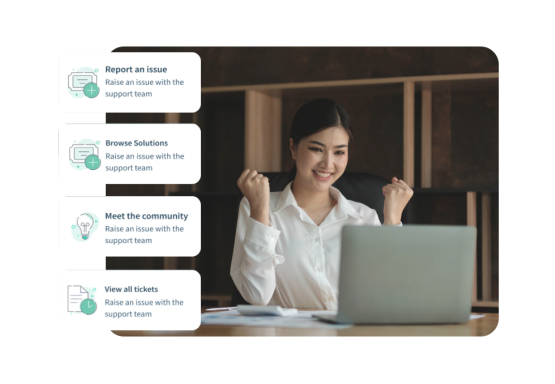
Improve your employee engagement with IT service desk which is equipped with features of internal ticketing, asset management, and contract management. Delight your employee with service catalog to fulfil their needs.
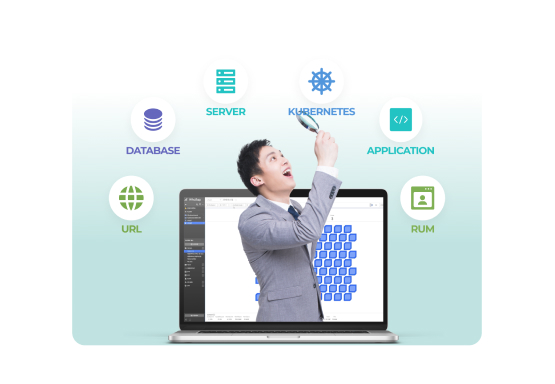
quickly identify the root cause of issues and eliminate risks before they impact your business. With real-time insights and proactive monitoring, you can take immediate action to ensure optimal performance and prevent costly disruptions.
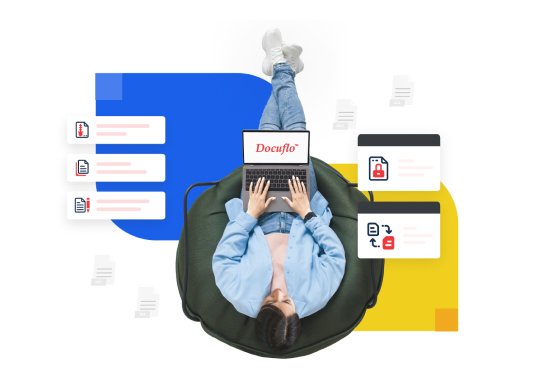
An Enterprise Document Management System which provides Collaboration Management, Content Classification, Audit Availability, and Simple Integration in a secured database/repository.
Improve your employee engagement with IT service desk which is equipped with features of internal ticketing, asset management, and contract management. Delight your employee with service catalog to fulfil their needs.
Protect your business with our IT Security solutions. Safeguard data, backup solutions, and prevent cyber threats with robust defences.
One Pro
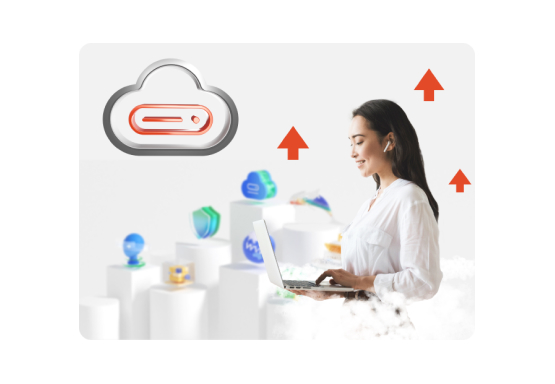
Smart Solutions for Efficient Data Migration and Recovery. HyperBDR and HyperMotion ensure that company data remains secure and well-managed, ready for instant migration and recovery. Powered by AI, OnePro’s solutions make the process faster, automated, and more efficient. Companies can focus on business growth without worrying about data.
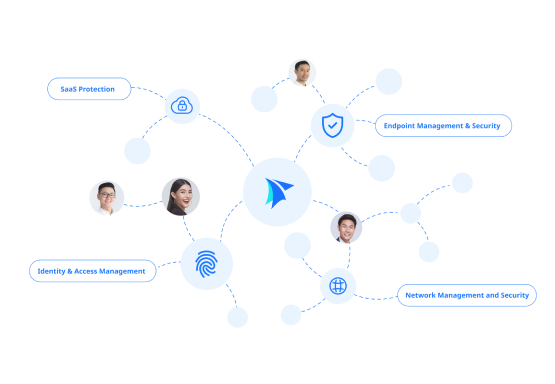
SealSuite offers comprehensive security solutions, including Identity and Access Management, Network Security with VPN and SD-WAN, and Endpoint Security such as antivirus, DLP, and SaaS Protection to safeguard cloud data.
Backup as a Service (BaaS) provides secure, cloud-based backup solutions to protect your critical data. With automated backups and easy recovery options, BaaS ensures your business data is always safe and accessible, minimizing downtime and data loss risks.
Smart Solutions for Efficient Data Migration and Recovery. HyperBDR and HyperMotion ensure that company data remains secure and well-managed, ready for instant migration and recovery. Powered by AI, OnePro’s solutions make the process faster, automated, and more efficient. Companies can focus on business growth without worrying about data.
SealSuite offers comprehensive security solutions, including Identity and Access Management, Network Security with VPN and SD-WAN, and Endpoint Security such as antivirus, DLP, and SaaS Protection to safeguard cloud data.
Optimize your operations with our ERP and Business Intelligence solutions. Unlock insights, streamline processes, and drive strategic growth with ease.
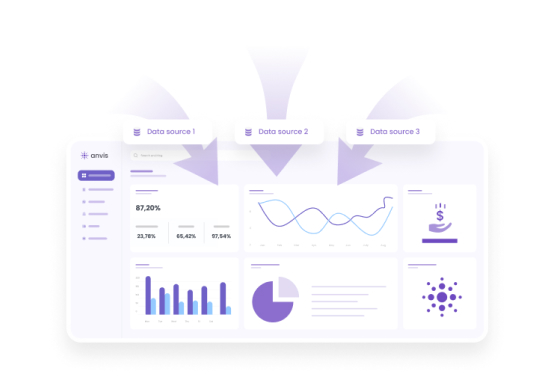
Anvis BI
Anvis BI Tools transform raw data into actionable insights with intuitive dashboards and comprehensive reporting features. With real-time analytics and seamless integration, Anvis helps businesses make data-driven decisions for improved performance and growth.
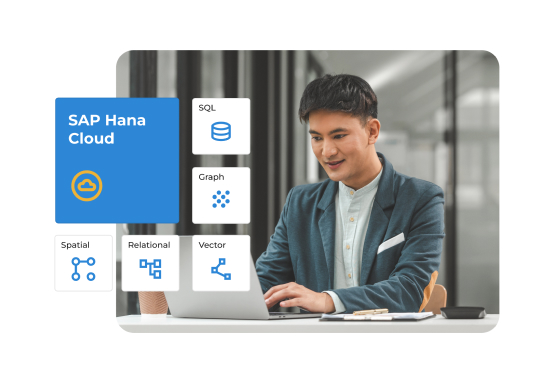
SAP S/4HANA is an intelligent ERP software that streamlines business processes in real time. With its advanced capabilities, SAP S/4HANA helps companies optimize operations, enhance decision-making, and drive digital transformation.
Anvis BI Tools transform raw data into actionable insights with intuitive dashboards and comprehensive reporting features. With real-time analytics and seamless integration, Anvis helps businesses make data-driven decisions for improved performance and growth.
SAP S/4HANA is an intelligent ERP software that streamlines business processes in real time. With its advanced capabilities, SAP S/4HANA helps companies optimize operations, enhance decision-making, and drive digital transformation.
“Freshservice is useful because Amartha has hundreds of branches throughout Indonesia and the assets are distributed within the branch.“
Andhika Wahyu Putra
Customer Service Manager at Amartha
“Before we had Freshchat and Freshdesk, we were struggling with the growth of customer operations. First Contact Resolution is one of the most important metrics for us. This is where Freshchat helps us incredibly“
Ahmad Johari
Vice President Operations at FinAccel
“After using Freshworks’ solutions, for integrated channels, we are able to tracking all clients/freelancers’ history and serve them better. Clear agent performance dashboard. Allows management to make decision better“
Ryan Gondokusumo
CEO at Sribu
“Freshworks’ solutions are simple and make us easier to pull data and review customer responses. The canned response feature can help us to answer customer questions accurately and quickly. WhatsApp integration simplifies our team answering customer questions.“
Susanti Santi
Senior Customer Service at HIJUP
“Thank you Freshworks for making our customer service team works easier.“
Rianda
Key Account Officer / Commercial at Kerry Express Indonesia
“Easy to use, allowed us to deliver better support to all our users. And always receive fantastic support from the Weefer team at Freshdesk.“
Niken R. Sutiesna
Customer Care Coordinator at Vidio.com
“Freshdesk is very helpful and offers many solution articles. The features we love the most are automations which can improve our productivity.“
Rizky Damayanti Putri
Lead of Customer Development at Dekoruma
“With Freshdesk, our company can manage and improve our client satisfaction as well as transparency process within the company. And the team is very helpful during our first year using this solution. We are looking forward to using more of Freshdesk features that will improve our reporting process as well.“
Wahyu Tri Widodo
Helpdesk Coordinator at Aino Indonesia
“Thank you for bringing Freshdesk to our work! This is the best way to overcome the thousands of emails we receive every day, this also greatly saved our time in making new tickets.“
Shinta Firmasari
Operation Maintenance Support at Protelindo
“Since we have been using Freshdesk, each issue can be monitored accordingly. It has been improving our SLA's business. Thank you Freshworks for providing such a good solution for our support team.“
Widjaya Hambali
Head of ICT at Sampoerna Kayoe
“Convenient and easy to use. Thank you Freshworks and Weefer team for facilitating us with such a great feature.“
Gracia Tanzil
CX Lead at Top Remit
“Freshdesk is our first customer support tool and we continue to use it for the last 5 years. The ticketing system makes it easier to track all the queries and the automated system helps us to increase our team productivity.
We have seen a Y-on-Y improvement at an average of 18% in our customer handling & effective internal coordination thanks to their knowledge base solution. Thank you Weefer & Freshdesk team for your awesome support.“
Putu Yuliana
Quality Analyst Supervisor
“Thank you for bringing Freshdesk to our work better and faster and more efficiently. With easy use and there are reports for data. Always success Freshdesk.“
Sabrina Ezra Shasya
Business Support at Beone Optima Solusi
“Thank you, Freshdesk is very user-friendly not only for the end-users but also for us. It is quite helpful for improving the SLA progress in our team.“
Marengga Dwi Hawanti
People Services Specialist at Alterra
“Freshdesk helping us a lot to deliver a great experience to our customers, Freshdesk offers so many features, it's really helping our operation to increase the productivity, at the same time we can manage better interaction and deliver happiness to our customers, also anytime we need help, we always got wonderful support both from Weefer and Freshdesk.“
Maulana Malik Muqorrobun
Customer Experience Manager at Bussr
“Freshservice is useful because Amartha has hundreds of branches throughout Indonesia and the assets are distributed within the branch.“
Andhika Wahyu Putra
Customer Service Manager at Amartha
“Before we had Freshchat and Freshdesk, we were struggling with the growth of customer operations. First Contact Resolution is one of the most important metrics for us. This is where Freshchat helps us incredibly“